Visualizing the results
After the benchmarks are executed, the different metrics are computed and written to a logfile. MoveIt! supply a script moveit_benchmark_statistics.py to parse this data and plot the statistics.
rosrun moveit_ros_benchmarks moveit_benchmark_statistics.py <path_of_logfile>
To generate a PDF of plots:
python -p <plot_filename> moveit_benchmark_statistics.py <path_of_logfile>
Alternatively, you can upload the database file generated by moveit_benchmark_statistics.py to planner arena and interactively visualize the results.
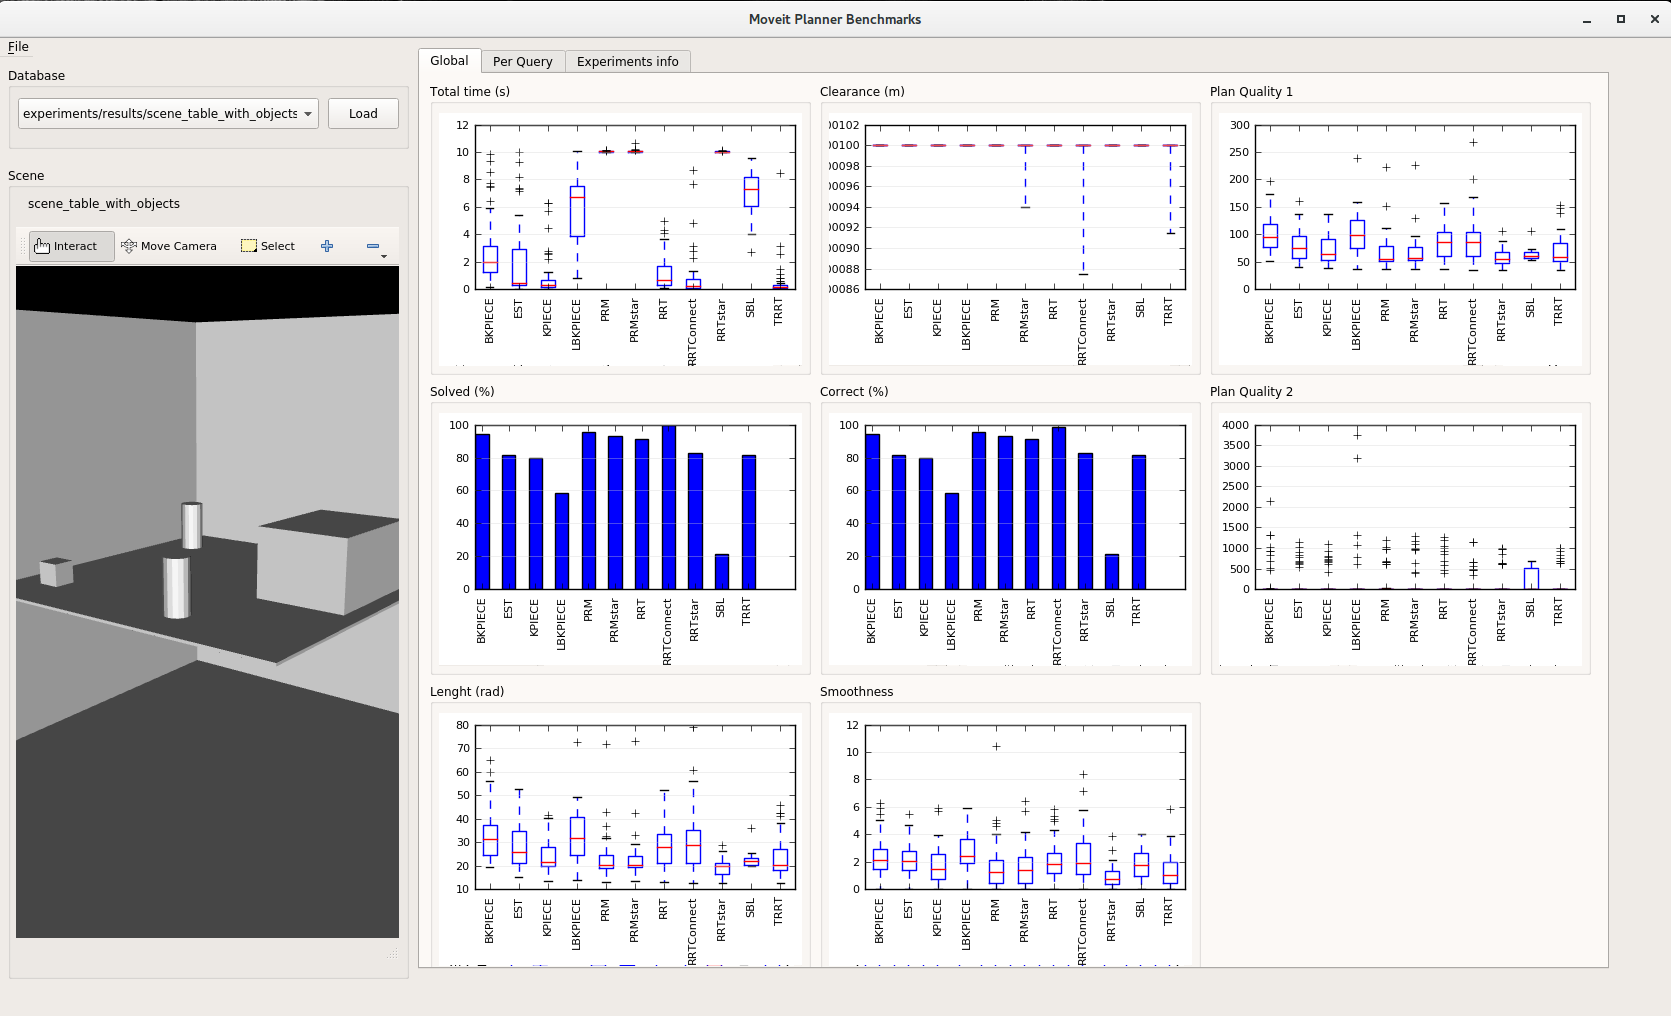
However, that was generated for each experiment and each graph was located in an entire page which make it difficult to compare the results. Therefore, we have improved the visualization of the results with the Benchmarks Visualizer, a graphical user interface that:
- Allows you to choose the benchmark database to visualize
- Displays the scene in rviz
- Shows information about the experiments performed on the selected database and also information about the benchmark metrics used in the graphs.
- Displays several graphs in one screen summarizing the results for each planner
- Displays the results per each query selecting a specific planner which will be useful to analyze the output of the different quality metrics
To run the benchmark visulizer, execute the following command:
roslaunch sr_moveit_planner_benchmarking benchmarks_visualizer.launch